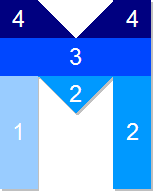
Maths filler
Imagine different shaped vessels being filled. Can you work out what the graphs of the water level should look like?
Problem
A series of vessels of uniform cross section look like letters when viewed face-on. They are 1cm thick, and the corners of the vessels have either whole or half cm values for their coordinates.

Water is poured slowly into each vessel through one of the holes at the top at a rate of 1 cm$^3$ per minute.
Seven of these vessels take the same time to fill up. Which are they?
Which one takes the longest to fill?
Which would fill up first?
The height of the pool of water in one of the vessels is measured and a chart of the height against time is plotted, as follows:
Which vessel does this chart correspond to?
Can you explain what each part of the chart corresponds to?
Can you make charts of height against time for some of the other letters?
Getting Started
Does it help to work out the cross sectional area of each letter?
Can you picture how full each letter would be if one cubic centimetre of water was poured in? What about two cubic centimetres?
Student Solutions
Well done to Anurag and Christina for their solutions to this problem:
The seven letters that take the same time to fill up are: I,L,O,E,M,T and H, all with a volume $14$cm$^3$ and thus taking $14$ minutes to fill.
The letter S takes the longest to fill up ($14.5$cm$^3$, $14.5$ minutes to fill).
The letter V fills up first ($13$cm$^3$, $13$ minutes to fill).
The letter A will take $13.5$ minutes to fill.
The graph corresponds to the letter M. Some points in the graph are over measured, for instance, the points between 4 and 5 cm.

Teachers' Resources
Why do this problem?
This problem requires careful thought about the way the water level in a vessel changes when water is added at a constant rate. Through analysing the key features of a graph, students can figure out the shape of the vessel it represents.
Possible approach
The first part involves working out volumes. The key is to realise that the cross-sectional area is proportional to the volume and then to work out the areas. There are obvious 'easy' candidates for this and some harder letters. There are various ways in which the areas of the cross sections of the vessels can be 'rearranged' to form rectangles. Students could work on finding the areas in small groups and then feed back to the rest of the class, sharing their approaches for finding the trickier areas.
To work out which letter the graph corresponds to, ask for suggestions for a 'story' relating the height-chart diagram to a vessel filling up. For example, what happens to the water level at the horizontal parts of the graph? What could be happening to account for this?
Once the class have identified the correct vessel for the graph, they could work on producing graphs for the other letters. Students could check each other's work by seeing if they can match the graphs with the vessels.
Small groups of students could also design some other letters in the same way and draw the resulting graphs, perhaps producing a card-matching activity to challenge other groups. The results could contribute to a classroom display.
Key questions
What could be happening at the horizontal parts of the height-time graph?
Possible support
How Far Does it Move? might provide a useful introduction to interpretation of graphs.
Start by working on the letters without diagonal lines and work out how quickly they will fill up.
Possible extension
Would the graphs change if the holes were moved, or if water was poured into both holes where available?
The final part of the M graph should be a curve rather than a straight line. Can students justify why the graphs for V, A, and S will also contain curves?
Can students work out the functions which describe any of these curved parts?
See also Maths Filler 2 for a suitable follow-up challenge.
