Graph Area
Problem
What is the area between the lines $y=2x-6$, $x=3$, $x=7$ and the $x$-axis?
This problem is adapted from the World Mathematics Championships
Student Solutions
Plotting the graph using a table of values
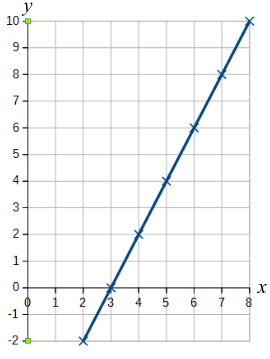
If we plot the graph first, then we will be able to see the shape whose area we are looking for.
We can use a table of values to plot the graph, and we are interested in $x$ values between $3$ and $7$, so going from $2$ to $8$ will help us see the whole shape.
If $x=2$, then $y=2\times2-6=4-6=-2$. The rest of the values can be found in the same way.
| $x$ | $2$ | $3$ | $4$ | $5$ | $6$ | $7$ | $8$ |
| $y$ | $-2$ | $0$ | $2$ | $4$ | $6$ | $8$ | $10$ |
The graph looks like this:
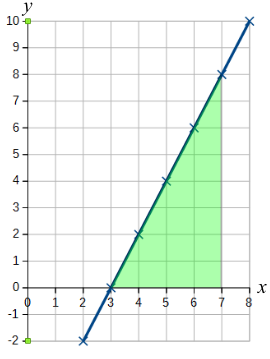
We need to find the area between $x=3$ and $x=7$, which is coloured green below.
The shape is a right-angled triangle, and its base is $4$ units and its height is $8$ units. So its area is $\frac{1}{2}\times4\times8=16$ square units.
Sketching the graph using relevant points
From the equation $y=2x-6$, we know that the graph will be a straight line.
Since we are interested in the area between $x=3$ and $x=7$, we could check where the graph is at those two points.
When $x=3$, $y=2\times3-6=6-6=0$.
When $x=7$, $y=2\times7-6=14-6=8$.
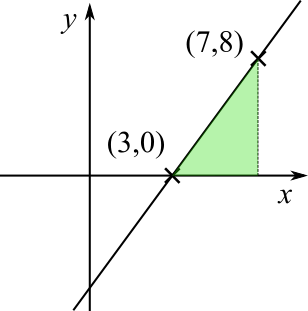
So $(3,0)$ and $(7,8)$ lie on the graph.
So the graph must be the straight line through those points, and the area required is the green area, as shown below.
The shape is a right-angled triangle, and its base is $4$ units and its height is $8$ units. So its area is $\frac{1}{2}\times4\times8=16$ square units.
