How Do You React?
Problem
In the problem Reaction Timer, two methods for testing the speed of reactions were introduced.

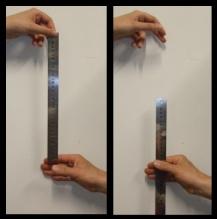
The second experiment suggested getting a friend to drop a ruler and measuring how far along it you could manage to catch. The shorter the distance, the quicker your reactions.
If two people caught the ruler at $15$cm and $30$cm do you think the first person's reactions are twice as fast as the second person's?
To investigate the relationship between the distance the ruler drops and the time taken, we need to do some mathematical modelling. We will assume that:
- the ruler can be modelled as a single particle, rather than something long and thin,
- there is no air resistance on the ruler as it falls.
| Time (seconds) | 0 | 1 | 2 | 3 | 4 |
| Velocity (metres per second) | 0 | 9.8 | 19.6 | 29.4 | 39.2 |
You could represent this graphically - what would the graph look like?
We can work out the distance travelled at each point in time, by multiplying the average velocity by the time taken. Complete the table below:
| Time (seconds) | 0 | 1 | 2 | 3 | 4 |
| Distance travelled (metres) |
You could represent this graphically - what would the graph look like?
Using your graph, or by deriving a formula, can you confirm your answer to the question posed at the start of the problem?
The average person's reaction time is about $0.2$ seconds. Where would you expect them to catch a ruler, according to your formula or graph?
Try the experiment for yourself and see if your reaction times are quicker or slower than average.
Getting Started
Student Solutions
Herschel of the European School of Varese sent us a very succinct solution.
Speed-time graph:
Since gravity exerts a constant force, the acceleration is also constant: $9.8ms^{-2}$. Therefore, speed is proportional to time and the speed-time graph shows a straight line (with a gradient of $9.8$).
Distance-time graph:
The distance travelled depends on the speed, which increases over time. Therefore, the distance travelled in the first second is less than that travelled during the second, which is in turn less than that travelled during the third. The graph is therefore a half-parabola with the gradient increasing over time. This means that it takes longer for the ruler to travel the first $15cm$ compared to the next $15 cm$, and a reading of $30 cm$ therefore indicates a reaction time that is slower, but not twice as slow!
To look at it algebraically, distance is calculated by the formula $d=\frac{1}{2}\times a\times t^2$. This means that the distance is NOT proportional to the reaction time, but instead to the SQUARE of the reaction time. Double the distance therefore means a reaction time that is 1.41 (i.e. the square-root of $2$) times slower rather than twice as slow. Rearranging the formula above to make $t$ the subject gives us $t=\sqrt{\frac{2d}{a}}$, which means the reaction time for $15cm$ is $\sqrt{0.03}=0.17$ seconds, while that for $30cm$ is $\sqrt{0.06}=0.24$ seconds - only $0.07$ seconds slower, or $41$%.
As for the "typical" $0.2$ seconds reaction time, the typical distance should be $0.5\times 9.8\times0.2^2=0.196m$ which is $19.6cm$. I found it hard to get consistant results for my own reactions - my distances ranged from $15cm$ ($0.17$ seconds) to $25cm$ ($0.23$ seconds). Incidentally, it's funny to note that a distance of $0.204$ meters ($20.4$ centimeters) corresponds precisely to a time of $0.204$ seconds!
Teachers' Resources
Why do this problem?
This problem brings together several mathematical ideas: modelling, using quadratic graphs to solve problems, rearranging quadratic formulas, and interpreting results in the context of a real-world problem.Possible approach
Key questions
Possible extension
When considering the validity of the modelling assumptions, learners could sketch how they think the graph might be changed if air resistance was taken into account.
