Copyright © University of Cambridge. All rights reserved.
'Probability Calculations from Tree Diagrams' printed from https://nrich.maths.org/
Show menu
This article is part of our collection Great Expectations: Probability through Problems.
The concept of multiplying the probabilities of events to find the probability of the combined event is often simply stated to students as a rule or method, without any justification or explanation. Our intention in this sequence of problems is to provide a structure which can be used to establish it more intuitively. Students progress from expected results as whole numbers (natural frequencies), to proportions of natural frequencies, to fractions - at which point we have probabilities.
A good place to start is by (re)visiting Which Team Will Win?
Start by reminding students of the problem, and that they used dice with four yellow sides and two blue sides to model the football games.
They should complete a tree diagram for the expected results over a 36-game season - this could be done as a class or individually, as appropriate.
The focus should then move to considering what proportion of the 36 games resulted in each outcome. A starting point could be:
This can then be followed up by discussing what proportion Team Beaver would be expected to win, and what proportion we would expect to be drawn.
It's important to keep the distinction between draws in which we expect Team Beaver to score first and those in which we expect Tearm Yeti to score first. It would also be good to draw attention to the fact that these two proportions are equal, even though the Yetis are twice as likely to score as the Beavers.
It will help students if they express proportions as fractions, rather than as decimals or percentages - extending the idea that TY would be expected to score 2/3 of the goals, and TB 1/3. Fractions should be expressed with a denominator of 36, to make it easier to see the connection with the whole numbers we started with. Of course, students can simplify these once they have grasped where the fractions come from and what they represent.
Students need to appreciate why the total proportions for the four possible outcomes should sum to 1 - in this case the proportions being 16/36 = 4/9 (YY), 8/36 = 2/9 (YB), 8/36 = 2/9 (BY) and 4/36 = 1/9 (BB).
This is a typical two-stage problem. It is modelled using multi-link cubes, with dice and coins used to determine outcomes.
The task is very similar to The Dog Ate My Homework, involving a similar experiment and analysis of results, and starts in a very similar way.
Students find the expected results for each outcome and represent these on a tree diagram (below right). In both problems, they can then use the tree diagram (and equivalent 2-way table) to answer questions of the type 'What proportion of athletes who have not been taking the banned substance would we expect to get a positive test result?'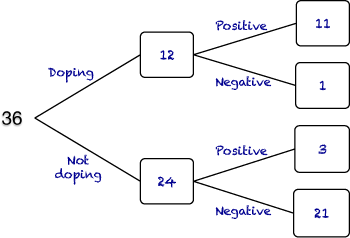
Who Is Cheating? is structured in a similar way, to build on The Dog Ate My Homework, but is intended to take students further by using the problem as a vehicle to develop an understanding of trees as probability trees, which can be used to aid calculations of probabilities.
A typical dialogue between the teacher and the class might develop as follows:
What proportion of the athletes who were taking the banned substance do we expect to test positive? Is it all of them?
No, one of them should test negative.
So what proportion of the athletes are doping but test negative?
1/36.
OK, so we expect that 1/36 athletes are doping and get a negative test.
But we don't always want to have to work with 36 athletes. We need a more general method which will give us answers for other numbers of athletes.
For this we need to focus on the proportions, rather than the numbers.
How could you use the tree to calculate that 1/36 proportion, starting from the 36 athletes?
If a third of the athletes are doping, that's 12 out of the 36 - that's this branch. Then there's a 1 in 12 chance they get a negative test - that's this branch.
OK, so we have 12 out of 36, that's 1/3, for the first branch, then 1/12 for the next branch, and they combine to give us the overall proportion of 1/36.
What we did was to find 1/12 of 1/3. What calculation does that correspond to?
Multiplication.
OK, let's test that out by thinking about the proportion of the 36 athletes who were not taking the banned substance who tested positive ...

Now I realise that the chances of it going smoothly like that may not be 100% (!), but several discussions along these lines, using all the four routes along the tree diagram should help students to grasp the argument. The individual probabilities (1/3, 2/3, 1/8 and 7/8) have been chosen so that they can be used to show the structure of the calculations (ie. there are four different calculations, and it can be made obvious which individual probability contributes to which answer).
Of course, this is not a formal proof of the multiplication rule. But arguments along these lines should help students to understand why we multiply along the branches. They should already be familiar with the idea of adding the results when they want more than one set of branches, from their work on the experimental and expected results of Which Team Will Win? and The Dog Ate My Homework!
Note that we have differentiated between the tree diagram used with whole numbers - the numbers are in the boxes at the ends of the branches - and the probability tree, where the outcomes are at the ends of the branches, and the probabilities are at the beginning of each branch.
The concept of multiplying the probabilities of events to find the probability of the combined event is often simply stated to students as a rule or method, without any justification or explanation. Our intention in this sequence of problems is to provide a structure which can be used to establish it more intuitively. Students progress from expected results as whole numbers (natural frequencies), to proportions of natural frequencies, to fractions - at which point we have probabilities.
Revisiting Which Team Will Win?
A good place to start is by (re)visiting Which Team Will Win?
Start by reminding students of the problem, and that they used dice with four yellow sides and two blue sides to model the football games.
They should complete a tree diagram for the expected results over a 36-game season - this could be done as a class or individually, as appropriate.
The focus should then move to considering what proportion of the 36 games resulted in each outcome. A starting point could be:
Given that Team Yeti are twice as likely to score a goal as Team Beaver, does that mean they ought to win twice as many games?
If not, what proportion do we expect them to win?
If not, what proportion do we expect them to win?
This can then be followed up by discussing what proportion Team Beaver would be expected to win, and what proportion we would expect to be drawn.
It's important to keep the distinction between draws in which we expect Team Beaver to score first and those in which we expect Tearm Yeti to score first. It would also be good to draw attention to the fact that these two proportions are equal, even though the Yetis are twice as likely to score as the Beavers.
It will help students if they express proportions as fractions, rather than as decimals or percentages - extending the idea that TY would be expected to score 2/3 of the goals, and TB 1/3. Fractions should be expressed with a denominator of 36, to make it easier to see the connection with the whole numbers we started with. Of course, students can simplify these once they have grasped where the fractions come from and what they represent.
Students need to appreciate why the total proportions for the four possible outcomes should sum to 1 - in this case the proportions being 16/36 = 4/9 (YY), 8/36 = 2/9 (YB), 8/36 = 2/9 (BY) and 4/36 = 1/9 (BB).
Moving on: Who Is Cheating?
This is a typical two-stage problem. It is modelled using multi-link cubes, with dice and coins used to determine outcomes.
The task is very similar to The Dog Ate My Homework, involving a similar experiment and analysis of results, and starts in a very similar way.
Students find the expected results for each outcome and represent these on a tree diagram (below right). In both problems, they can then use the tree diagram (and equivalent 2-way table) to answer questions of the type 'What proportion of athletes who have not been taking the banned substance would we expect to get a positive test result?'
Who Is Cheating? is structured in a similar way, to build on The Dog Ate My Homework, but is intended to take students further by using the problem as a vehicle to develop an understanding of trees as probability trees, which can be used to aid calculations of probabilities.
A typical dialogue between the teacher and the class might develop as follows:
What proportion of the athletes who were taking the banned substance do we expect to test positive? Is it all of them?
No, one of them should test negative.
So what proportion of the athletes are doping but test negative?
1/36.
OK, so we expect that 1/36 athletes are doping and get a negative test.
But we don't always want to have to work with 36 athletes. We need a more general method which will give us answers for other numbers of athletes.
For this we need to focus on the proportions, rather than the numbers.
How could you use the tree to calculate that 1/36 proportion, starting from the 36 athletes?
If a third of the athletes are doping, that's 12 out of the 36 - that's this branch. Then there's a 1 in 12 chance they get a negative test - that's this branch.
OK, so we have 12 out of 36, that's 1/3, for the first branch, then 1/12 for the next branch, and they combine to give us the overall proportion of 1/36.
What we did was to find 1/12 of 1/3. What calculation does that correspond to?
Multiplication.
OK, let's test that out by thinking about the proportion of the 36 athletes who were not taking the banned substance who tested positive ...
Now I realise that the chances of it going smoothly like that may not be 100% (!), but several discussions along these lines, using all the four routes along the tree diagram should help students to grasp the argument. The individual probabilities (1/3, 2/3, 1/8 and 7/8) have been chosen so that they can be used to show the structure of the calculations (ie. there are four different calculations, and it can be made obvious which individual probability contributes to which answer).
Of course, this is not a formal proof of the multiplication rule. But arguments along these lines should help students to understand why we multiply along the branches. They should already be familiar with the idea of adding the results when they want more than one set of branches, from their work on the experimental and expected results of Which Team Will Win? and The Dog Ate My Homework!
Note that we have differentiated between the tree diagram used with whole numbers - the numbers are in the boxes at the ends of the branches - and the probability tree, where the outcomes are at the ends of the branches, and the probabilities are at the beginning of each branch.