Copyright © University of Cambridge. All rights reserved.
'The Domesday Project' printed from https://nrich.maths.org/
Show menu
Why do this problem?
This activity provides an opportunity to engage pupils in fruitful discussion about meaningful data. It can be linked with history since the data were recorded before people had sophisticated computer programmes for displaying information as we do today. It gives a forum for a whole group or class discussion, thereby providing a situation
where pupils need to listen carefully to what others are saying, and follow the thinking behind what has been said.
Possible approach
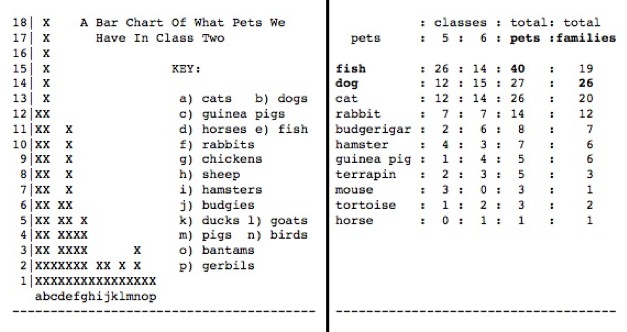
You could begin by telling the class a bit about the Domesday Project and then give out copies of the seven sets of data to small groups or pairs (data.pdf). (The data could be cut into seven separate cards.) Give learners time to explore and interpret the data, prompting where necessary using
the questions in the problem.
There are likely to be two main points for discussion: what the data tell us and the ways the data has been presented. Some children might begin to make hypotheses and draw tentative conclusions from the data, perhaps also thinking about how the data might be different if similar surveys were conducted now. Others may comment on the way the classes in used their
wordprocessing skills to display the data they had collected. Encourage pupils to compare the merits of the different ways of presenting the data. Which do they think is most effective and why?
Key questions
Why do you say that?
What area of the UK do you think would give these data?
How might the results of these surveys be different now, compared with 1986?
How would you choose to display these data? Why?
Possible extension
Encourage learners to choose one set of data and represent it in a different, more effective way.
Possible support
Some may need one-to-one help in understanding the different representations. You could begin by asking a question such as "Can you tell me something you have learned from this chart/table?" as this should help you gauge the difficulties the pupil might be having.
