Copyright © University of Cambridge. All rights reserved.
'Class 5's Names' printed from https://nrich.maths.org/
Show menu
Why do this problem?
This problem uses simple and manageable information to illustrate various methods of recording data. The questions require learners to interpret the data presented, as well as to re-present the data in different ways themselves. You could also encourage children to look at ways to present data more critically by discussing which
method they think is best and why.
Possible approach
The focus of this particular task is not on data collection itself, but you may wish to tackle this problem once the children have had some experience of creating their own tally charts, frequency tables and bar charts. Alternatively, the activity could be a vehicle for introducing some different ways of representing data which learners may not have come across before.
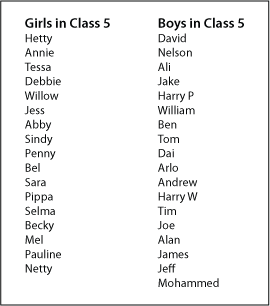
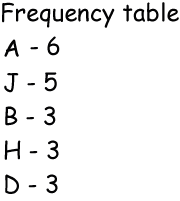
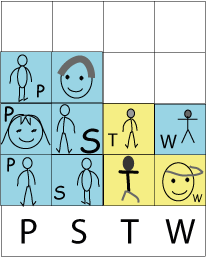
Tell the 'story' of the problem and invite pupils to work in pairs. They might find it useful to have a copy of the names given at the beginning of the problem and this sheet which contains the tally chart, fequency table and bar chart. Allow pairs to choose the resources they need to create the
different representations, although having squared paper easily available is likely to be helpful.
In a plenary, initiate discussion about how they knew which member of the class was away that day and encourage them to offer opinions on which of their representations is best for this data. Listen out for those that give clear explanations for their choices.
Key questions
What does this chart/table tell you?
Tell me about the way you're creating your chart/table.
What can you tell from the tally/table/graph you have made?
How do you know who was away from school that day?
Possible extension
The problem Real Statistics offers more opportunities for data analysis, and goes on to invite data collection and further analysis.
Possible support
The Pet Graph is a simpler challenge which focuses just on a block graph.


