Genetic Intrigue
Genetics is a hugely important topic area in biology. From Mendel's experimentation with pea plants and theories of inheritance, to Watson and Crick's determination of the physical nature of the genetic code, right up to the present day in the form of the Human Genome Project, our understanding of genetics has expanded rapidly over the last century. There is still so much more to discover.The field of genomics holds much future promise as it involves analysing patterns in the full genomes of organisms, something we know very little about. Progress in terms of medical genetics, identifying the link between diseases and certain gene variants remains rapid. These are just some of the interesting branches at the cutting edge of genetics. Here we provide an elementary introduction to some core genetic topics.
Inheritance
Gregor Mendel was one of the early pioneers in the field of genetic inheritance. Mendel used true breeding garden pea plants (Pisum sativum) to investigate how seven different phenotypes were represented in the offspring of parent plants across generations. These experiments led Mendel to propose that:
- Genes are particulate and there is no blending of phenotypes
- Each plant contains two genes for each character and the phenotype defines which of these two alleles is the dominant one
- Members of each gene pair segregate equally into gametes and the fusion of gametes does not depend upon which gene it contains
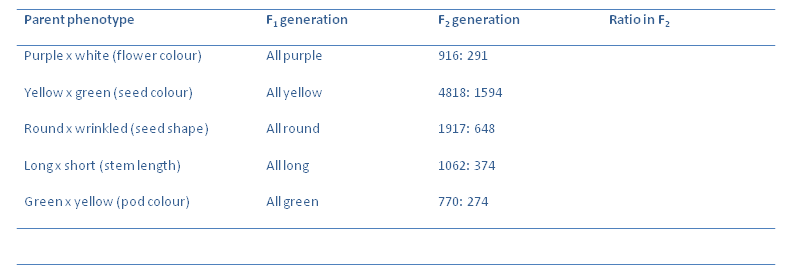
Now we can quantify the results obtained:
Calculate the ratios of the F$_2$ generations of the plants. Which is the dominant allele in each crossing?
What is the average ratio in each case? Using one cross as an example, draw a Punnet square to illustrate the observed phenotypic ratios.
Take for example the cross between a plant producing yellow peas and one producing green peas. The F$_1$ generation had plants that all produced yellow peas. The F$_2$ generation had a 3:1 ratio in terms of yellow peas: green peas. When breeding the F$_2$ with each other to produce an F$_3$ generation. Of the 623 yellow pea F$_2$ plants, 199 gave F$_3$ plants all having yellow peas and 424 gave F$_3$ plants which has yellow peas or green peas. When the green pea plants of the F$_2$ were selfed the offspring all had green peas.
Can you work out what is going on?
What is the ratio of true breeding yellow parents to plants that acted like F$_1$ plants in the F$_2$ generation?
Draw a Punnet square to explain the observed ratios.
This above analysis was highly useful in formulating Mendel's Laws of Inheritance. For scientific theories to be valid, they must of course be testable. Mendel chose to conduct a backcross of a heterozygous F$_1$ with a homozygous recessive parent.
What ratio would need to be observed for the hypothesis to be upheld?
Mendel also considered what would occur if two genetic loci were investigated. For example, consider a cross between plants with purple flowers and short stems (PPll) with plants with white flowers and long terms (ppLL). The F$_1$ generation would consist of plants with purple flowers and long stems.
What would be the genotype of the F$_1$ generation?
The F$_2$ generation consists of plants with purple flowers and long stems, purple flowers and short stems, white flowers and long stems, and white flowers and short stems.
What possible genotypes could plants having these phenotypes have? Give all the possibilities.
The F$_1$ plants that give rise to the F$_2$, produce gametes containing one allele of a gene present at each locus.
What possible combinations of alleles could be present in a gamete?
A dihybrid cross can be used to calculate the expected ratios of the phenotypes in the F$_2$ generation. This cross works in a similar fashion to a Punnet square, except due to it being across 2 loci, the combinations of alleles present in the gametes are listed for each organism being crossed instead of a single allele. An example of a dihybrid cross for cat coat colour is given below. Each genotype is assigned the correct phenotype and the ratio of the offspring in the generation determined.
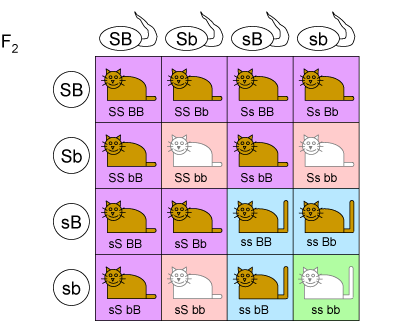
Construct a similar dihybrid cross for the F$_2$ generation of plants (cross of two purple flowered, long stemmed F$_1$ plants).
Assign a phenotype to each genotypic possibility. What is the ratio of phenotypes in the F$_2$ generation?
This ratio, if found for the phenotypes in an F$_2$ generation produced in a breeding experiment, is indicative of the independent segregation of two pairs of alleles. This means that each combination of alleles in the gametes of the F$_1$ plant is equally likely. In other words there is no interaction between the two genes in terms of segregating into alleles in the process of meiosis.
Mendel's laws of inheritance provide an interesting overview of simple genetics. However many of his findings are not held to be universally true. Situations of codominance, genetic linkage and X-linked inheritance are just some of those circumstances known to exist as exceptions to Mendel's rules. Slight modification of Mendel's laws have been necessary in light of later experimental evidence.
Genetic linkage and recombination
As discussed previously, Mendel's principles have needed slight modifications to still be valid in light of new experimental evidence. This is the case for the situation of genetic linkage.
Mendel stated that genes segregated independently of one another and this can be seen to be true if individual genes are on different chromosomes. However, if there is more than one gene per chromosome then can the inheritance of these two genes be linked? i.e. is it more likely that certain allelic combinations segregate together?
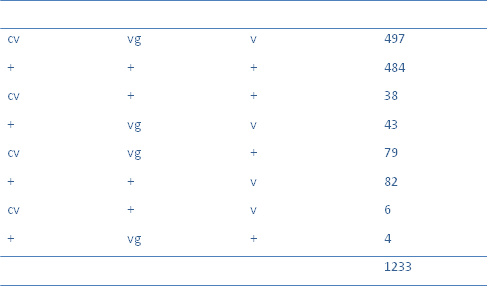
Experimental evidence suggested that this could be the case. Bateson and Punnet for example found that pollen shape and flower colour showed an inheritance pattern where parental genotypes are more likely. Thomas Hunt Morgan's Drosphila melanogaster studies of the inheritance of purple eyes (pr) and vestigial wings (vg) also indicated that linkage was a real phenomenon. Morgan suggested that the two genes were carried on the same pair of homologous chromosomes and pairing during meiosis lead to new genetic combinations, a process known as recombination. It was eventually conjectured that chiasmata formation between homologous chromosomes and crossing over lead to the exchange of genetic material.
Chromosome mapping
Gene interactions
Of course the human genome is a highly complex assemblage of genetic code. Genes can interact with both the external environment and each other in terms of their expression. The effect of gene interaction may be seen by considering the relationship between the genotype of an individual and its phenotype.
An interesting genetic interaction is epistasy. This is when the effect of one gene is masked by the effect of another meaning it does not find expression in the phenotype of an individual. An example of this is the eyegone gene in Drosphila which is clearly epistatic to any eye colour gene as eye formation itself does not occur! Another interesting genetic phenomenon is the "viability effect". Certain mutations may actually slow the growth of certain species in such a way that they become under-represented in the population. These effects are quite common in mutated genes in fungi such as Aspergillus nidulans.
Example
Coat colour in mice is a quality determined by interactions at several genetic loci. Genes influencing the distribution, type, and presence of pigment are known to exist. We will consider the case where the loci are unlinked and so are either present on different chromosomes or widely spaced apart on the same chromosome.
Here are some of the genes involved:
A: A (agouti), a, A$^{\text{y}}$ (lethal yellow), a' (black and tan)
B: B (black), b (brown)
C: C, c (albino), ch (Himalayan)
D: D, d (dilution)
S: S (spots), s (piebald)
So the genotype aaBB corresponds to a mouse with a black coat. The genotype BBcc corresponds to an albino mouse, demonstrating that the c allele is epistatic to all other colours. Interestingly these interactions may be more complex. For example the genotype AAbb gives rise to a cinnamon coat colour.
Take for example, the cross between a cinnamon coloured mouse (AAbb) and a black mouse (aaBB).
The F$_1$, produces mice of phenotype AaBb which are all agouti.
The F$_2$ are 9 agouti (A-B-), 3 cinnamon (A-bb), 3 black (aaB-) and 1 brown (aabb)
Using a dihybrid cross, predict what the ratio of phenotypes in the F$_2$ of a cross between a mouse with a dilute black coat colour (BBdd) and a mouse with a brown coat colour (bbDD). [Note that there are no further complexities with phenotype in this case.]
Restriction mapping
Previously we met a situation where the mapping of a chromosome could be conducted by considering the recombination frequency of certain genetic markers in a cross. Now we consider a method where enzyme catalysed digestion of DNA can give a cruical insight into its structure.
A wide variety of bacteria produce restriction endonucleases in order to cleave foreign DNA and so destroy its coding capacity. This is a useful strategy against infecting bacteriophages. The cuts that a restriction endonuclease makes to a molecule of DNA may be flush or staggered, giving protruding sticky ends.
Why do you think that restriction enzymes don't digest the bacterium's own DNA?
Examples of restriction enzymes include EcoR I, Hind III and BamHI. Most recognize a specific DNA sequence that is 4-6 bases long and palindromic. For example the recognition sequence of EcoR I (produced by the bacterium E. coli) is 5' GAATTC 3'.
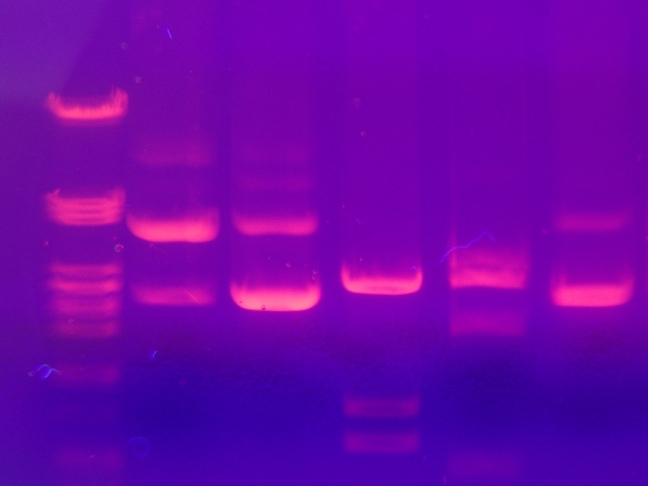
Purified restriction enzymes are used to cleave DNA molecules into fragments and separation of fragments by molecular weight can be achieved through elecrophoresis through an agarose gel that has the correct pore size for this application. Visualisation of the DNA is achieved by staining with ethidium bromide and using UV light.
Depending on the number of sequence recognition sites in the sample DNA, each restriction enzyme cleaves to produce a different number of fragments of varying length. It is useful to know that a plot of distance migrated by a fragment against log (molecular weight) gives a straight line relationship, meaning that running fragments of unknown sizes against known fragments can allow for an estimation of molecular weight.
Restriction sites are used as physical markers in a similar way to how genetic markers were used in the Drosphila cross experiments. Consider the mapping of a circular bacterial plasmid. Digestion with a single particular enzyme will produce a single fragment if there is only one recognition site in the plasmid. If other enzymes also produce a single fragment, it can be said that there is only one recognition site for these enzymes in the plasmid as well. Multiple digests can then be used to determine where these sites lie in terms of one another. The sizes of the fragments produced can be ascertained by the comparative methods outlined earlier: run alongside fragments of a known length.
Consider the complete and partial restriction of the following linear molecule of DNA:
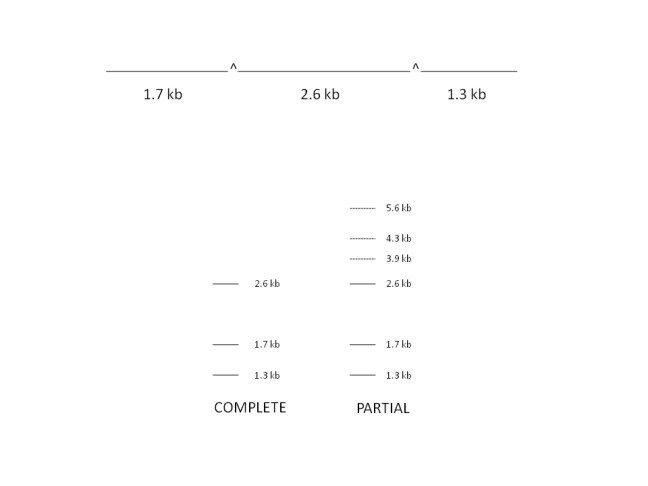
Partial digestion using low concentrations of restriction enzymes or altering experiment time causes extra bands to appear in a DNA sample after it is run on agarose gel. These bands correspond to fragments with adjacent sections attached i.e. digestion has not occured at all possible restriction sites. These bands are highly useful in classifying the order of fragments obtained in a complete digest, with the restriction sites once again acting as markers.
In the example above, extra bands appear in the partial digest at 3.9 kb and 4.3kb as well as at 5.6 kb corresponding to the whole undigested molecule. A very similar approach may be applied to circular plasmid molecules.
Consider a circular plasmid pXY1 which is digested using different combinations of EcoRI, BamHI and TaqI. After running the fragments on an agarose gel alongside fragments of known size produced by digesting bacteriophage $\lambda$ with Hind III, the following data was obtained:
Enzyme(s) Fragment sizes (kb)
TaqI 3.7, 3.2, 2.1
TaqI + EcoRI 3.7, 3.2, 1.8, 0.3
TaqI + BamHI 3.7, 2.1, 1.6
EcoRI + BamHI 7.1, 1.9
Construct a restriction map of this circular plasmid pXY1 after reading the following section.
Take the case of a mystery circular plasmid. The plasmid was digested with the restriction enzymes PstI, HindIII, and EcoRI and the size of the fragments produced calculated after electrophoresis through an agarose gel.
Enzyme(s) Fragment sizes (kb)
PstI 6.8, 5.9
HindIII 6.4, 6.3
EcoRI 9.2, 3.5
PstI + HindIII 4.9, 4.4, 1.9, 1.5
PstI + EcoRI 5.5, 3.7, 3.1, 0.4
EcoRI + HindIII 6.3, 3.5, 1.8, 1.1
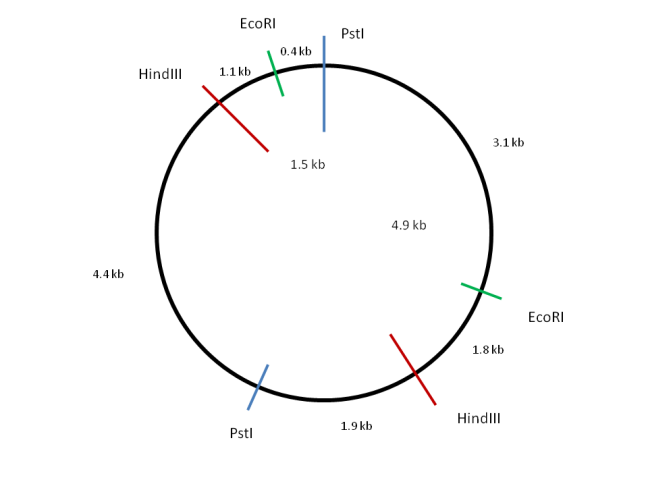
First an outline of the circular plasmid is drawn and the zero position marked with a vertical line. Now consider a digestion using one of the restriction enzymes. PstI produces two fragments of 6.8kb and 5.9kb. Sites of PstI digestion can be marked onto the diagram to roughly reflect the sizes of the fragments obtained.
Looking at HindIII, two fragments of 6.4kb and 6.3kb are produced. These sum to the same value as the PstI fragments indicating that the total size of the plasmid is 12.7kb. The restriction sites for HindIII can also be marked onto the diagram either side of the marked PstI restriction sites. Now look at the PstI + HindIII digest and label the fragment lengths accordingly.
Considering the EcoRI sites finally, it is clear that they lie closer together than any of the other sites. Position the restriction sites such that a 6.3, 3.5, 1.8 and 1.1 kb fragmentation pattern results when combined with the HindIII sites already marked. Check the distances with the PstI + EcoRI digest to ensure they are correct.
Genetic Analysis of Metabolic Pathways
Many fungi and bacteria can be grown on synthetic media of a known chemical composition. This means single gene mutations introduced into organisms which affect a certain metabolic pathway can be characterised. This is because mutation can cause the requirement for a specific chemical for growth depending on which step in the pathway if affected.
Mutants which require a specific supplement are produced and can be genetically analysed to see how many genes are involved. Furthermore, the mutants are grown on media containing various intermediates in the metabolic pathway to investigate where in the pathway the mutation is acting. This approach is often sufficient to identify the intermediates and their order of formation.
In an experiment, a 1st year scientist replicates a master plate containing 26 colonies of the fungus Aspergillus to 5 plates containing different media. The plates have a nitrogen source that is an intermediate in the metabolic pathway that degrades hypoxanthine to NH$_4^+$.
The scientist wants to establish:
1) The growth responses of each of the strains
2) The order of intermediates in the pathway
3) The strains which are blocked in each step giving an idea of the genetics underlying the growth patterns
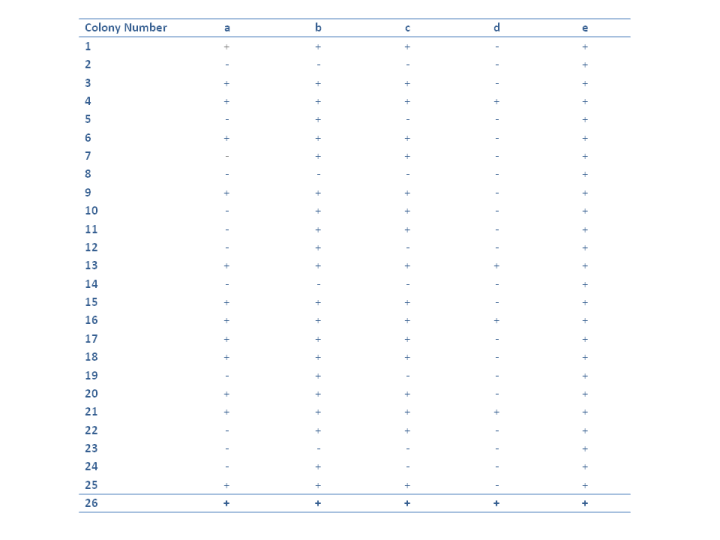
The table above shows the process by which the growth of the fungus is classified, where the "+" indicates growth of the strain on this medium and a "-" scoring means no growth.
Can you think what the purpose of the colony number 26 is, given it grows on all the media?
The order of intermediates a $\rightarrow$ can be determined.
If a mutation occurs affecting a step of a metabolic pathway close to the initial susbstrate, then if the species is plated onto media containing nutrients occuring downstream as intermediates in the pathway, then growth is still possible.
If mutation occurs affecting a step of the metabolic pathway close to the final product, then if a species is plated onto media containing nutrients occuring upstream as intermediates in the pathway, growth still won't be possible because of the mutation!
As all of the strains are capable of growth on media containing e, it must occur closest to NH$_4^+$ in the pathway. Using a similar analysis the order can be established as:
Hypoxanthine $\rightarrow$ d $\rightarrow$ a $\rightarrow$ c $\rightarrow$ b $\rightarrow$ e $\rightarrow$ NH$_4^+$
Can you determine which strains are blocked in which steps of the pathway? For example the step d $\rightarrow$ a is blocked by the mutants 1,3,6,9,15,17,18,20 and 25. What does this imply about the species genetically?
Such analysis is highly useful in the early investigation into the genetics behind metabolic pathways.
In this article, we've covered topics ranging from Mendelian inheritance, chromosome mapping, genetic interactions, the genetic analysis of metabolic pathways and restriction mapping. Hopefully over the course of this article you have gained an appreciation of some useful genetic concepts you will frequently encounter in your future studies.
