Copyright © University of Cambridge. All rights reserved.
'Reaction Rates!' printed from https://nrich.maths.org/
Show menu
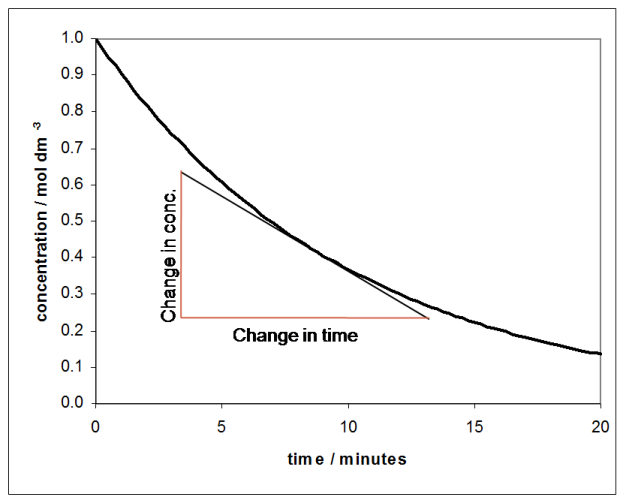
The rate of a reaction is usually expressed as the change in concentration of a species divided by the time during which that change took place. If a graph of concentration against time is plotted, the rate is the gradient of the graph, which is found by drawing a tangent to the curve:

The graph above shows the concentration of a chemical species against time, and since the concentration of the species is falling over time, the gradient of the graph is negative. If the concentration of the product was plotted against time, the gradient would be positive since the concentration increases with time.
From the graph it can be seen that the rate (i.e. the gradient) is changing with time and, of course, with concentration. For many reactions it is found that the rate is proportional to the concentration raised to some power. If the rate depends on the concentration raised to the power of one, the reaction is called first order:
$$\text{first order:}\ \ rate = k_1[A]$$
In this equation, [A] represents the concentration of the species A and $k_1$ is the first order rate constant which has units of time$^{-1}$. If a graph of rate against concentration is plotted, a straight line of gradient $k_1$ would be observed.
However, if the rate is proportional to the square of the concentration, the reaction is called second order: $$\text{second order:}\ \ rate = k_2[A]^2$$
$k_2$ is the second order rate constant which has units of concentration$^{-1}$ time$^{-1}$. For such a reaction, a plot of rate against concentration squared should yield a straight line of slope $k_2$. Note that the order of a reaction cannot be determined simply from the coefficients in the balanced chemical equation.
Consider the equation below. What is the order of reaction with respect to A? B? C? Overall? What would such orders mean physically?
$$ rate = k\frac{[A]^{\frac{3}{2}}[B]^{2}}{[C]^{\frac{1}{2}}} $$
NOBr decomposes in the gas phase according to the following equation:
$$2NOBR_{(g)} \rightarrow 2NO_{(g)} + Br_{2\ (g)}$$
The reaction is second order in NOBR:
$$rate = k_2[NOBR]^2$$
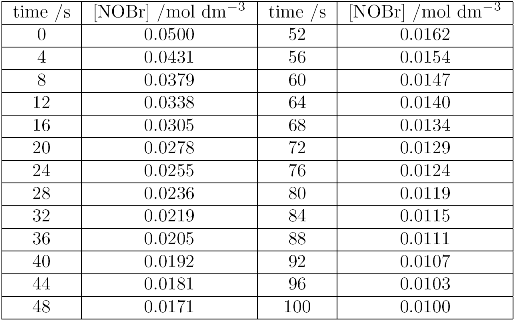
The following data show the concentration of NOBr, measured as a function of time:

(i) Plot a graph of concentration against time; draw a smooth curve through the points.
(ii) For about five different concentration draw a tangent to the curve and determine the gradient of the tangent. This gradient is that rate at the chosen concentration.
(iii) Plot a second graph of the rates you determined in (ii) against the square of the concentration. You should find this to be a straight line, and its gradient will be the second order rate constant, $k_2$. Find the gradient as best you can, as there will be a degree of scatter!
(iv) You may see in higher study that a more convenient way of analysing a second order reaction is to plot 1/concentration against time; it will be shown that such a graph is a straight line with gradient $k_2$. Using the data above, plot a third graph of 1/[NOBr] against time. Find the gradient, $k_2$, and compare it with the value found in (iii).
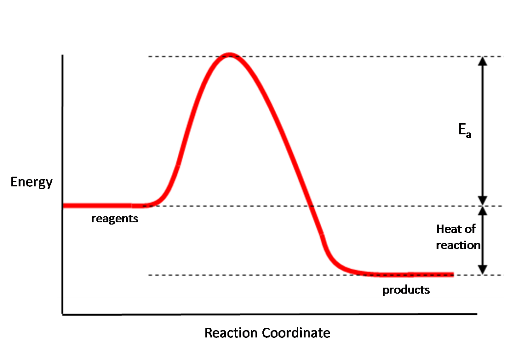
When considering a reaction, we can draw a plot showing how the energy of molecules involves varies as we pass from reagents to products; such a plot is called an energy profile, and a typical example is shown below:

In this plot the products are lower in energy than the reactants, so energy is given out when going from reactants to products - the reaction is exothermic. As shown above, on this diagram the heat of reaction is the difference in energy between the reagents and products. For most reactions there is also an energy barrier which has to be overcome in order to go from reagents to products. This barrier is called the activation energy, $E_a$, and as shown on the diagram is the energy gap between the reagents and the top of the barrier.
Draw energy profiles for the reactions which have an activation energy and which are (a) endothermic and (b) exothermic. Mark each plot with the activation energy and the heat of reaction.
(ii) Also mark on your plot the activation energy of the reverse reaction i.e. the one where products go back to reactants.
(iii) For a reaction which is endothermic when going from reagents to products, what is the relationship between the activation energy of the forward reaction, the activation energy of the back reaction and the heat of reaction?
(iv) Some reactions, such as those between atoms i.e $I + I \rightarrow I_2$, have zero activation energy. Draw energy profiles for reactions which are (a) endothermic and have zero activation energy, (b) are exothermic and have zero activation energy and (c) have zero heat of reaction but a finite activation energy.
[Reproduced with the kind permission of James Keeler and Peter Wothers, Department of Chemistry, University of Cambridge]