PDF Matcher
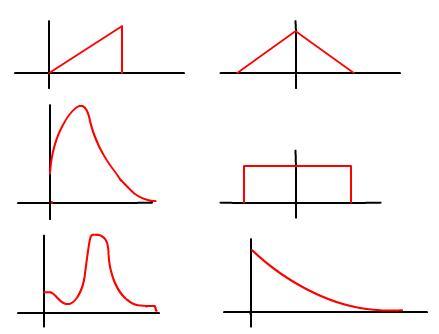
Which pdfs match the curves?
Problem
I have a series of six probability density functions $X$, each of which satisfies at least one of the following conditions:
- $X$ is non-negative.
- $X$ can take any positive value.
- $X$ is a reasonably realistic pdf for a model of a share price of a bank in a year's time.
- The probability of $X$ taking a value in the range $(a, b)$ is the same as the chance of $X$ taking a value in the range $(-b, -a)$.
- $X$ is a reasonably realistic pdf for a model of human life expectancy.
- There is a number $a$ such that $P(x> a) \geq 2 P(x> 2a)$.
Which of the following six curves (ignoring scale) would be the potential candidates for these mathematical descriptions? Are multiple matches possible? What axes and scales would you choose in each case?

Student Solutions
Part 1:
Statement 1: All
Statement 2:None
Statement 3: Curves 2 and 3
Statement 4: Curves 4 and 5
Statement 5: Curve 2
Statement 6: Curve 2, 3, 4 and 6
Curve A:
IV characteristics of an ohmic device
Curve B:
Curve C:
Curve D:
Curve E:
This curve appears to be the integral of a sinusoid. It could therefore represent the total electrical power dissipated as a function of time for a device through which we pass an alternating current
Curve F:
This curve could represent the amplitude of oscillation of an undammed spring which is the suddenly stopped.
Curve G:
This curve could represent the magnitude of a pendulums displacement from its equilibrium position (assuming the pendulum begins at maximum displacement).
Curve H:
Charging of a capacitor
Curve I:
Radioactive decay. This curve could represent the number of nuclei decaying per second from some radioactive source.
Curve J:
Normal distribution: Height or weight
This could also be a resonance curve. The Y axis could be the amplitude of osciallation and the X axis could represent the frequency of the input, at the natural frequency we would get a very high amplitude response.
Curve K:
Curve L:
This curve could represent the fracture toughness of an alloyed metal, the Y axis representing the fracture toughness and the x - axis representing the volume fraction of the alloy.
