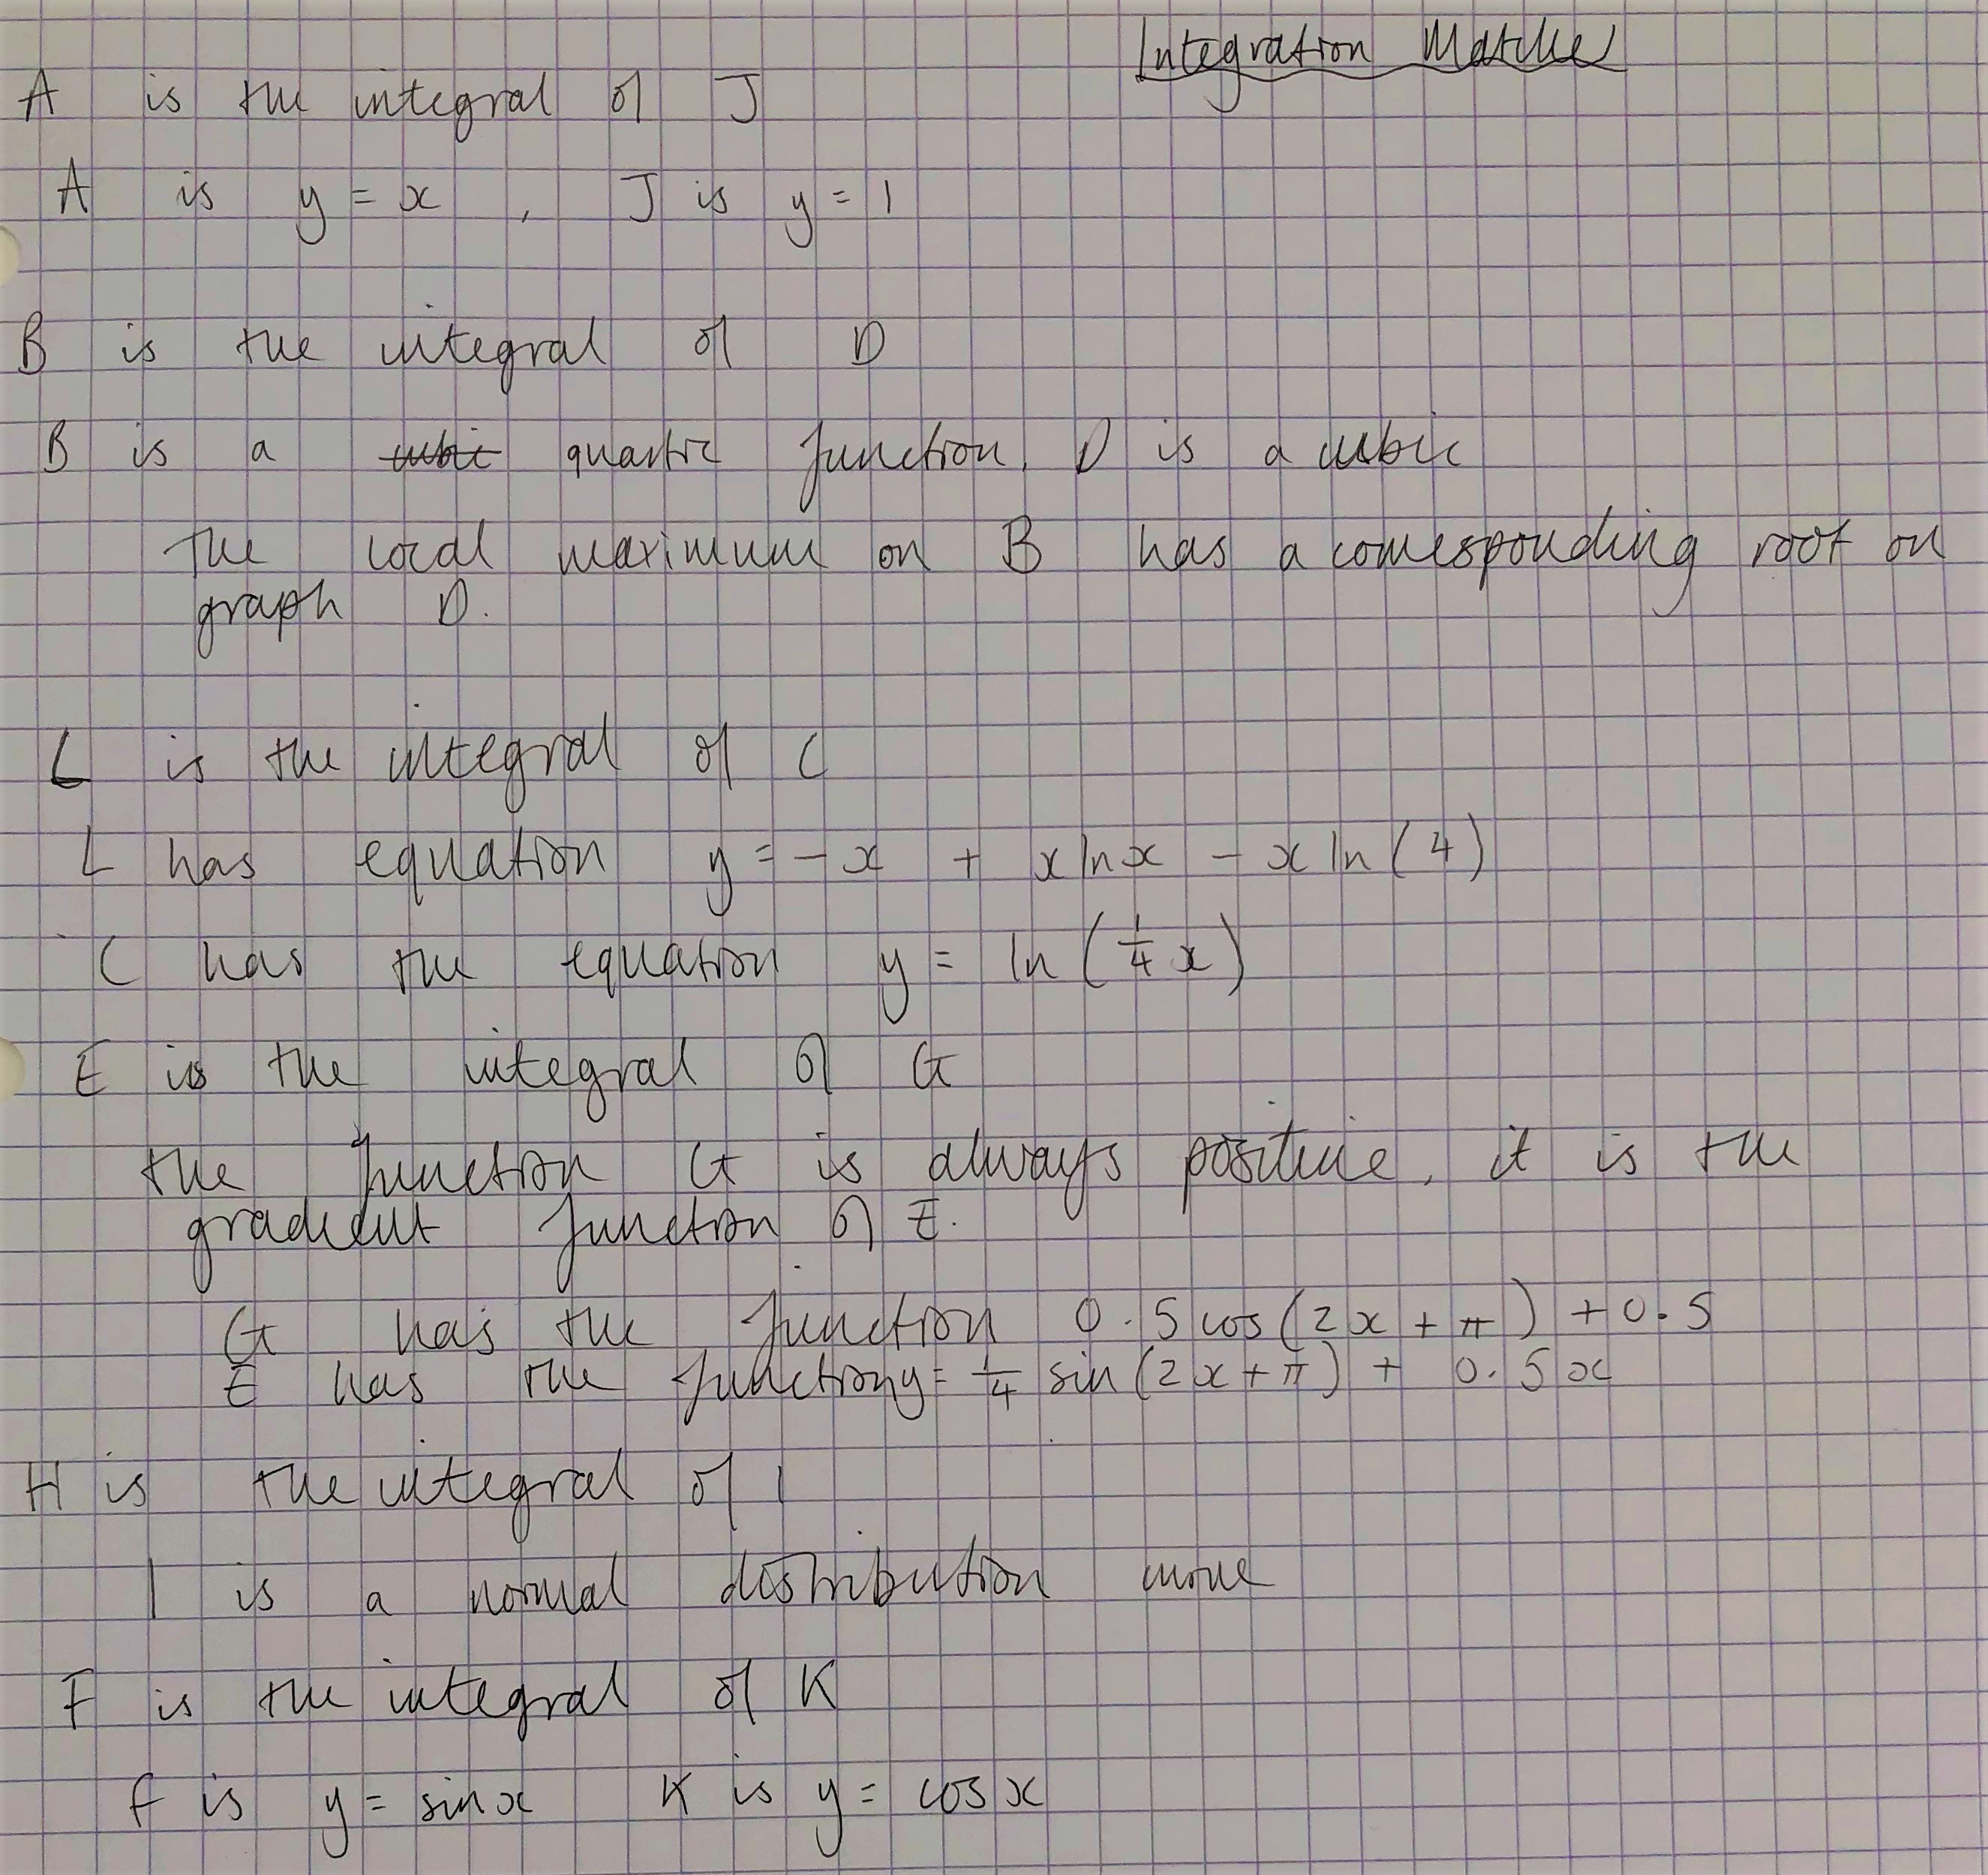
Integration Matcher
Can you match the charts of these functions to the charts of their integrals?
Problem
The graphs of six functions and the graphs of their integrals have been mixed up below. Can you match them together?
Image

| Image

|
| Chart A | Chart B |
Image

| Image

|
| Chart C | Chart D |
Image

| Image

|
| Chart E | Chart F |
Image

| Image

|
| Chart G | Chart H |
Image

| Image

|
| Chart I | Chart J |
Image

| Image

|
| Chart K | Chart L |
You might like to print off copies of the graphs: Integration Matcher
What strategies did you use to match them up?
Can you make suggestions of algebraic forms for the functions used? You could plot your functions in GeoGebra or Desmos to see if your suggestions match the graphs.
Getting Started
If you have not yet met integration, here are two ways to approach the problem:
Integration can be considered as anti-differentiation, so see if you can match each function with a function showing its gradient.
Alternatively, integration shows the area under a curve, so by estimating the areas in each interval, you can deduce the shape of the integral function.
Student Solutions
David from St Peter's College, Adelaide, Vignesh from Hymers College in the UK, Rikhil and Pratosh from Tanglin Trust School in Singapore and Florence from Roedean in the UK matched the functions correctly. This was the beginning of David's strategy:
For doing the matchers question, we always start with the easiest one first. Obviously, we can see the function of chart J is just $y=1$, and chart A is $y=x.$ Hence, we can match up A with J first.
Also, we notice that chart F and chart K are trigonometric functions ($y=\sin x$ and $y=\cos x$), hence, we can also easily match up F with K.
Florence, Rikhil and Pratosh also assumed that F and K showed $y=\sin x$ and $y=\cos x$, but Vignesh worked it out without making this assumption:
The function of an integral must always start at the origin. From this we can definitely conclude that chart C, chart J and chart K are all functions (not integrals).
Chart K seems to fluctuate between being positive and negative and so its integral must be fluctuating between positive and negative. But when the graph of chart K crosses the x axis, the area under the curve will still continue to be positive, it will be positive until the area above the curve but below the x axis is large enough to counteract the positive area. So we have a choice between chart D and chart F as chart K's integral. However, if we look at chart D closely it seems to be tending towards an asymptote which means that the area under K must be getting infinitely large at some point but that doesn't seem to be the case. Therefore, chart K and chart F must match.
David continued:
The rest of the charts are difficult to find their function expression, but we notice that integration can be considered as anti-differentiation. Therefore, we can match each function with a function showing its gradient.
We can draw the tangent line to those charts, for example, chart B has horizontal tangent lines(which means the slope of the tangent is 0) at about x=4.1 and x=7.9, and chart D has y=0 when x=4.1 and x=7.9 (approximately) Chart D shows the slope function of Chart B, hence, we chart B is the integral of chart D.
Rikhil, Pratosh and Florence all assumed that charts B and D were a quartic and a cubic respectively, and used that to match them. Vignesh thought about areas again:
Chart D is negative between approximately $x=4.3$ and $x=7.9$. However, all the other graphs are positive, from this information we can conclude that chart D must be a function and not an integral of a function, as none of the other graphs have an opportunity to have negative area. The area under chart D is positive at the start but during the given interval it should decrease because of the negative area, and chart B has a local maximum roughly $x=4.3,$ the same point chart D crosses the $x$ axis. Finally, the chart B also tends to infinity the same time chart D does and so chart B must correspond to chart D.
Vignesh, Rikhil and Pratosh used area for the other charts. David used a mixture of areas and gradients, and Florence used gradients.
Pratosh:
In chart G, the area under the curve increases equally from 0 to just over 3, then from just over 3 to just over 6, and so on. Also, the rate at which the area increases in these intervals first increases, then decreases. The only graph which shows this trend is chart E.
Rikhil:

Vignesh:
Notice that for chart C the area under the curve is initially negative and only one other graph is negative between the limits x=0, x=4 and that is chart L. We can also justify why the function continues to be negative, because the area under the curve in chart C after x=4 must not be large enough to cancel the negative area at the start, thus giving an overall negative area.
Click here to see Florence's work involving gradients instead of areas and further deductions about the equations shown on the graphs.
Teachers' Resources
Using NRICH Tasks Richly describes ways in which teachers and learners can work with NRICH tasks in the classroom.
Why do this problem?
Possible approach
This printable version of the charts may be useful: Integration Matcher
Now introduce the problem - explain that the functions can be paired up. For classes who have not yet met integration: "These graphs come in pairs. For each function $f(x)$ there is a graph of the function $A(x)$ where $A(x)$ is the area under the curve $y=f(t)$ between $t=0$ and $t=x$. Can you match each graph of a function $f$ with its corresponding graph of the area function $A$?"
Students could work in pairs to match up the graphs. It is important that they give evidence for why they believe that each pair goes together; their reasoning could be discussed in small groups or as a whole class. Students who have met the idea of integration as anti-differentiation could use this to check their pairings by looking for turning points mapping to a zero on the derivative graph.
Key questions
If the area function has a turning point, what is happening to the original function at that point?