Picturing Square Numbers
Square numbers can be represented as the sum of consecutive odd numbers. What is the sum of 1 + 3 + ..... + 149 + 151 + 153?
Problem
Picturing Square Numbers printable worksheet
The diagram shows that 1 + 3 + 5 + 7 = 16.

What is the sum of the first $30$ odd numbers?
What is the sum of the first $60$ odd numbers?
Can you describe a method for working these out quickly?
Can you make $3249$ by adding odd numbers in this way?
What is the value of:
$1 + 3 + ... + 149 + 151 + 153$?
$83 + 81+ ... + 5 + 3 + 1$?
$51 + 53 + 55 + ... + 149 + 151 + 153$?
$2 + 4 + ... + 150 + 152 + 154$?
$2 + 6+ ... + 298+ 302+ 306$?
Explain how you worked these out.
Getting Started
How could you describe the squares that are formed?
What is the relationship between the square numbers and the first and last numbers in their respective sequence of consecutive odd numbers?
Student Solutions
Well done to all of you who sent in correct solutions. We've received lots of good solutions to this problem, including detailed solutions from: Salaar (Durham Johnstone Comprehensive School, UK), Advaith (Surya the Global School in India), Enzo and Ziqian (Harrow International School Hong Kong), Aarna (Wallington High School for Girls, UK), Ci Hui (Queensland Academy for Science Mathematics and Technology, Australia), Siena (Guildford High School, UK), Jiaqi (Christ Church CE Primary School, UK), Romany (Pate's Grammar School, UK), Shaunak (India), Turker (Mark Twain IS239 Intermediate School for the Gifted and Talented, US), and Amay, Ananya, Kanaa, and Dia (Ganit Kreeda, Vichar Vatika, India).
A lot of you spotted the crucial connection with square numbers, including Beth and Oscar (Longcroft School), Sid (Twyford School), Logan (Altrincham Grammar School for Boys) and Arjun (Pate's Grammar School) all in UK, Ishika and Reeve (Ganit Kreeda, Vichar Vatika, India), Lucilla (Dulwich College Beijing, China) and Jaco and George (Harrow International School Hong Kong).
Hannah from Millom School in Cumbria sent in a nicely articulated solution:
The diagram shows that the sum of the first $4$ odd numbers is $16$ because there are $4$ rows and $4$ columns of counters. For the sum of the first $20$ odd numbers there are $20$ rows and $20$ columns. So if I do $30 \times 30$ (or $30$ squared) I get an answer of $900$. For the sum of the first $60$ odd numbers there are $60$ rows and $60$ columns. So if I do $60 \times 60$ (or $60$ squared) I get an answer of $3600$.
If you want the sum of the first $n$ odd numbers the answer would be $n$ squared.
I worked out that $153$ is the $77$th odd number. I did this by adding one (to get $154$) and then divided the answer by $2$.
The sum of the first $77$ odd numbers is $77\times77$ which is $5929$.
To find $51 + 53+ 55+\cdots+ 149 + 151 + 153$ I used the answer from the previous question which was $5929$.
As we were starting at $51$ this time and not $1$, I needed to find the sum of all the odd numbers from $1$ up to $49$. I found that $49$ is the $25$th odd number (by adding $1$ to $49$ and then dividing the answer by $2$) So the sum of the odd numbers from $1$ to $49$ is $25$ squared which is $625$.
Finally I took $625$ away from $5929$ to give an answer of $5304$.
David decided to use algebra to explain his thinking:
The sum of the first $30$ odd numbers $= 30^2 = 900$.
The sum of the first $60$ odd numbers $= 60^2 = 3600$
Quick Method: The sum of the first $n$ odd numbers $= n^2$
What is the sum of $1 + 3 + \cdots + 149 + 151 + 153$?
The formula for odd numbers is $2n-1$
We have: $2n-1 = 153$
$2n = 154$
$n = 77$
So $153$ is the $77$th odd number. The sum of the first $77$ odd numbers $= 77^2 = 5929$. Therefore, the sum of $1 + 3 + \cdots+ 149 + 151 + 153 = 5929$
What is the value of $51 + 53 + 55 + \cdots+ 149 + 151 + 153$?
The answer is the sum of ($1 + 3 + \cdots + 149 + 151 + 153$ - which is already worked out) minus the sum of ($1 + 3 + \cdots +49$)
$49$ is the $25$th odd number (as $2n-1 = 49 \Rightarrow 2n = 50$, so $n = 25$)
Therefore the value of $51 + 53 + 55 + \cdots + 149 + 151 + 153 = 77^2 - 25^2 = 5304$
Shaunak from India also used algebra, but specifically used the method of proof by induction to prove the connection with square numbers. You can see this approach here.
The method I found is if we have to add up to the first $k$ odd numbers, the sum is $k^2$
Proof: I will prove by induction.
Base Case: $k = 1$
$1 = 1^2$
$1 = 1$
Induction Hypothesis:
Assume $1 + 3 + 5 + \cdots +k^{th} \,\rm{odd \,number} = k^2$
To prove: $1 + 3 + 5 + \cdots +k^{th} \,\rm{odd \, number} + (k+1)^{th} \, \rm{odd \,number} = (k + 1)^2$
Induction step: If n is the $k^{th}$ odd number, then $n = 2k – 1$.
Then $1 + 3 + 5 + … + 2k – 1 = k^2$
Add $2(k + 1) – 1 = 2k + 1$ to both sides.
$1 + 3 + 5 +\cdots + 2k – 1 + 2k + 1 = k^2 + 2k + 1$
$k^2+ 2k + 1 = (k + 1)^2$
Therefore $1 + 3 + 5 + \cdots + 2k – 1 + 2k + 1 = (k + 1)^2$. Hence proved.
We asked you whether $3249$ could be made by adding odd numbers in this way. We had lots of solutions for this that used the connection with square numbers. Turker from the Mark Twain IS239 Intermediate School for the Gifted and Talented in US gave this explanation:
You can make $3249$ by adding odd numbers
$n^2=3249$
$\sqrt{n^2}=\sqrt{3249}$
$n=\sqrt{3249}$
$n=57$.
The first 57 odd numbers will add up to $3249$.
Like David, a lot of you noticed that $51 + 53 + 55 + \cdots+ 149 + 151 + 153$ is the difference of two sums of odd numbers and you could then use your previous answer to $1 + 3 + 5 + \cdots+ 149 + 151 + 153$. Ziqian from Harrow International School Hong Kong represented this with a diagram. As Ziqian said,
This question is a bit trickier, for it doesn’t start from 1, but 51. So we have to imagine it as a squared number subtracted by a square number.
Kanaa from Ganit Kreeda came up with an alternative approach. She subtracted 50 from each of the 52 terms in the sum.
$51 + 53 + 55 + \cdots+ 149 + 151 + 153$
$-50 -50 -50 -\cdots -50 -50 -50$
She then worked out the value of $1+3+5+ \cdots+99+101+103$ using her previous method and added on the $52$ lots of $50$.
$1+3+5+ \cdots+99+101+103$
$=52 \times 52$
$=2704$
$52\times 50 = 2600$
Final answer $=2704+2600=5304.$
We had lots of solutions to the last two sums, so well done to everyone who sent us a solution for these. Amay, also from Ganit Kreeda, and Kanaa both used a similar method to Kanaa’s method above to find the fourth sum by subtracting $1$ from each term. This turned the sum into the previously solved $1+3+5 + \cdots +151+153$. Therefore the final answer was $5929+77=6006.$ Brilliant work Amay and Kanaa for turning a new problem into one you'd already solved!
Shaunak also connected the sum $2+4+6+\cdots+152+154$ with a problem already solved, but took a different approach. Shaunak noticed that this is the sum of all the even numbers up to $154$, and that this can be formed by summing all the numbers from $1$ to $154$ and subtracting the sum of just the odd numbers from $1$ to $153$, the problem already solved. This is Shaunak's working:
$153$ is the $77^2$ odd number so the sum is $77^2= 5929$.
The sum of all numbers up to $154 $ is $154\times \dfrac{155}{2} = 11935$.
$11935 – 5929 = 6006$.
Sanat worked with other students from Ganit Kreeda and sent a video sharing his approach.
Many of you also spotted that you can work out the sums in this problem using a method that’s also in Slick summing. Well done to Aarna from Wallington High School for Girls, Salaar from Durham Johnston Comprehensive School, Jiaqi from Christ Church CE Primary School, Arjun, Romany and Oliver from Pate's Grammar School and Siena from Guildford High School, all in UK, Enzo from Harrow International School in Hong Kong, and Ananya from Ganit Kreeda in India and Shaunak also in India for making this connection!
Finally, a group of students from Ganit Kreeda (Tejas, Prapthi, Sanat, Valerie, Dia, Mantavya, Varun, Thejasvi) worked together to explore this problem further using similar diagrams to the one we started with. Here's a taster of the problems and a diagram showing the approach taken by Varun, Thejasvi and Prapthi:
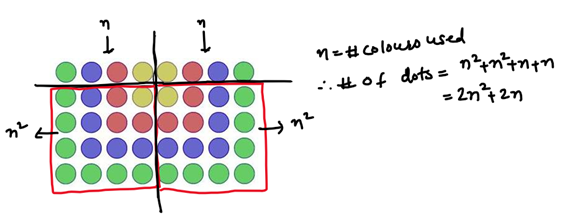
The group also explored how they could work out the number of dots in this diagram. Varun's approach, shown here, separated the original square from the array.
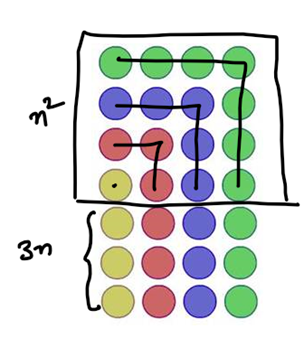
So the total number of dots $=n^2+3n$ where $n=$ number of colours.
We'd love to hear if these extensions of the problem have given you any ideas for connecting $2+4+ \cdots +150+152+154$ and $2+6+ \cdots+298+302+306$ with the starting diagram. Please email us if you've got any ideas about this.
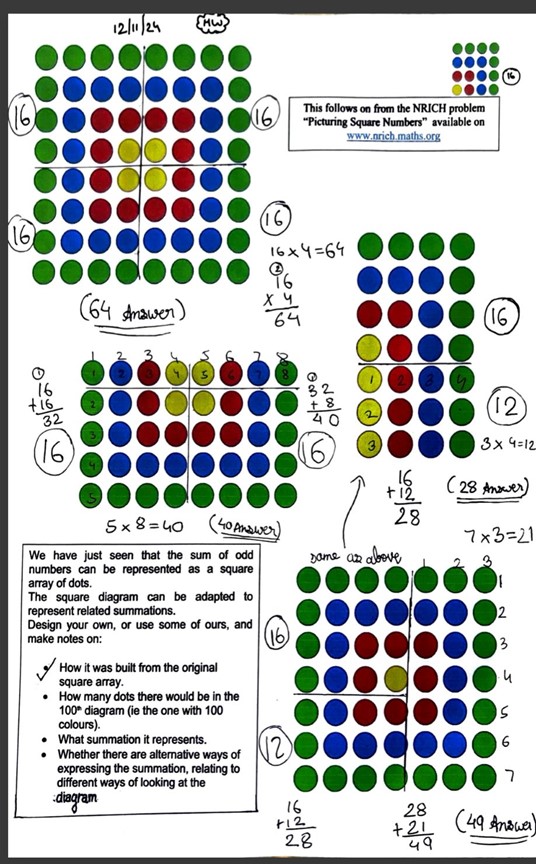
Here is further work by Mantavya and Dia on this extension to the problem. Please try to think about the problems for yourself before reading their arguments.
Mantavya worked on specific cases of several diagrams. Here is Mantavya's work:

Dia worked on similar diagrams and also explored generalisations of the cases they show.
Teachers' Resources
Using NRICH Tasks Richly describes ways in which teachers and learners can work with NRICH tasks in the classroom.
Why do this problem?
This problem develops the links between visualisation, verbal description and algebraic representation.
Possible approach
This printable worksheet may be useful: Picturing Square Numbers.
Kick off by talking about odd numbers:
What do the first $10$ odd numbers add up to?
What do the first $5$ odd numbers add up to?
What is the $50$th odd number anyway? The $100$th?
$125$ is an odd number. Which is it?
Show students this image or the interactivity
Ask for comments on the arrangement of dots.
"How can this help us explain the relationship between square numbers and the sum of odd numbers?"
"How many more dots will I need to add to make the next square? And the next? And the next?"
"How many more dots will I need to go from the $100$th square to the $101$th?"
Set students off to work in pairs on the questions set in the main body of the problem: Picturing Square Numbers
Key questions
What is the $5$th, $10$th, $455$th odd number?
What is the sum of the first $10$, $20$, $50$, ... $n$ odd numbers?
Possible support
This task could be used as a context for working hard on odd numbers and their structure, practising doubling numbers and mental addition. Tasks could include adding sets of odd numbers, imagining the last layer on the $30$th square, the $57$th square, working out which square would have $43$ as its last layer.
To prepare students for looking closely at other sequence pattern diagrams, the interactivity could support discussion between students - how they imagine the next diagram will look, whether different students see it differently.
Possible extension
A suitable extension task is provided in this worksheet .
For another problem that uses a similar idea go to Picturing Triangle Numbers